Tables are written with pipes and dashes. This post shows the shapes you’re likely to need, and the data in all of them is made up.
A simple table
| Part of the brief | Weak | Strong |
|---|---|---|
| Who | Everyone | Customers on the old plan |
| Goal | Something about the launch | Explain the new pricing |
| Tone | Professional | Calm and plain |
| Length | Short | 100 words |
Aligned columns
The colons in the divider row set the alignment: left, centre and right.
| Item | Status | Hours |
|---|---|---|
| Write the brief | Done | 1.5 |
| Review the draft | In progress | 0.75 |
| Publish | Not started | 0.25 |
| Total | 2.5 |
Formatting inside cells
| Thing | How it looks | Notes |
|---|---|---|
| Code | npm run build |
Runs the build |
| A link | The About page | Opens inside the site |
| Emphasis | Bold and italic | Both work in cells |
| Two lines | First line Second line |
A line break inside one cell |
A wide table
This table has more columns than fit in the column of text. On a narrow screen it should scroll sideways inside its own box and leave the rest of the page still.
| Month | Posts | Words | Visitors | Returning | Subscribers | Shares | Replies | Notes |
|---|---|---|---|---|---|---|---|---|
| January | 4 | 5,200 | 1,820 | 210 | 14 | 31 | 6 | First month |
| February | 4 | 5,650 | 2,140 | 290 | 21 | 44 | 9 | Steady |
| March | 5 | 6,900 | 2,980 | 410 | 33 | 70 | 12 | A post did well |
| April | 3 | 3,800 | 2,310 | 380 | 35 | 38 | 8 | Quiet month |
Charts as images
A chart is an image like any other. The text underneath is its caption.
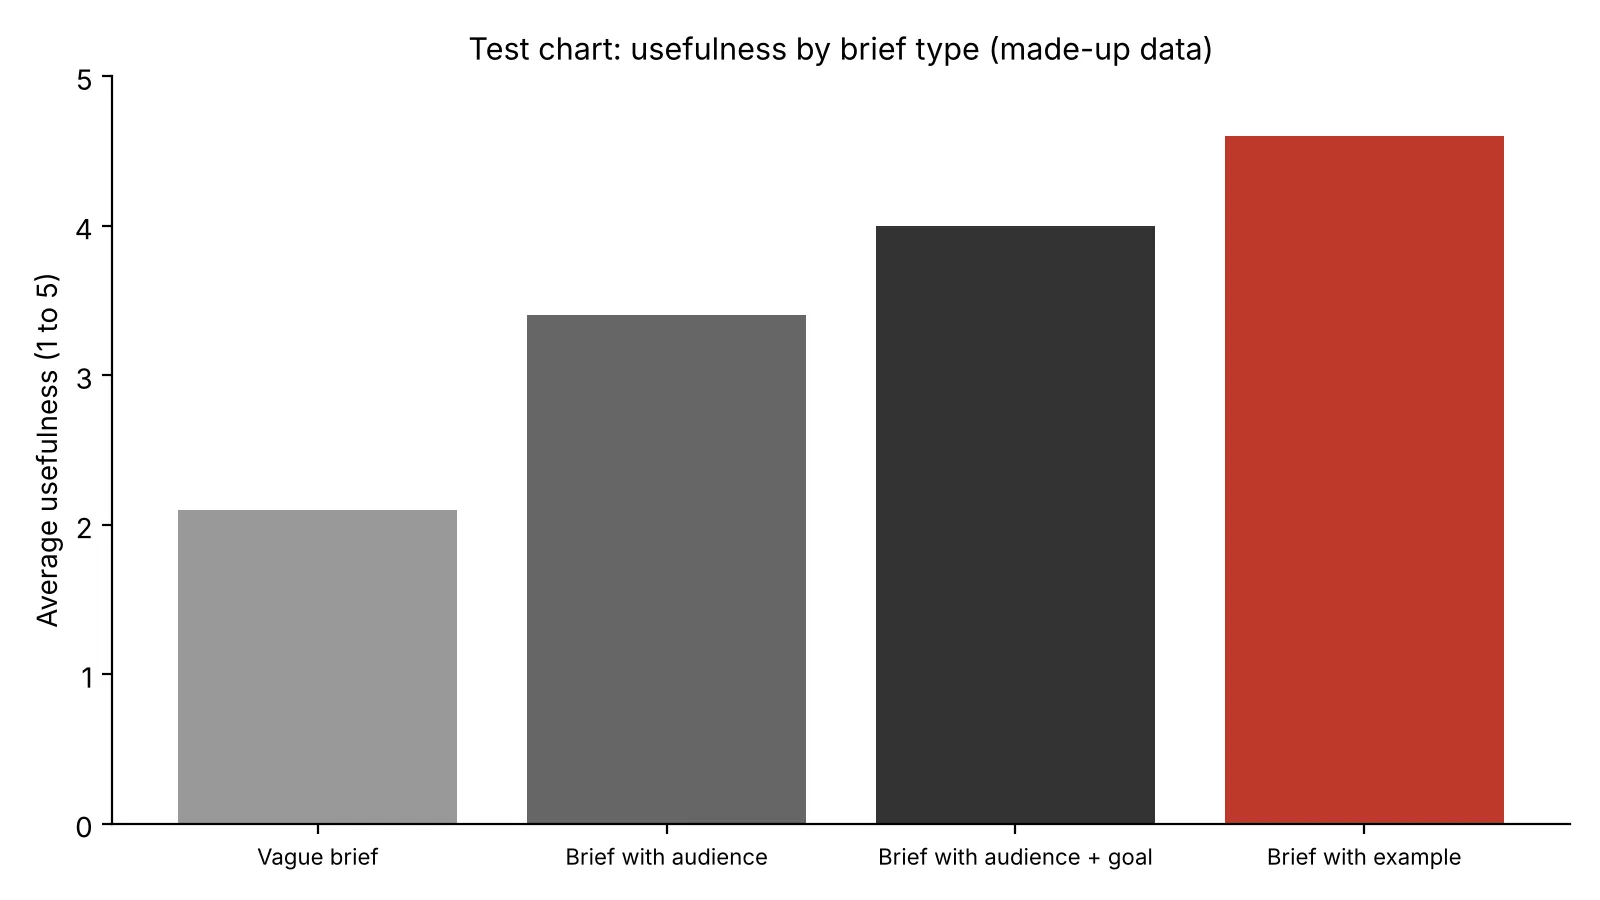
Figure 1. A bar chart. The numbers are invented for this test.
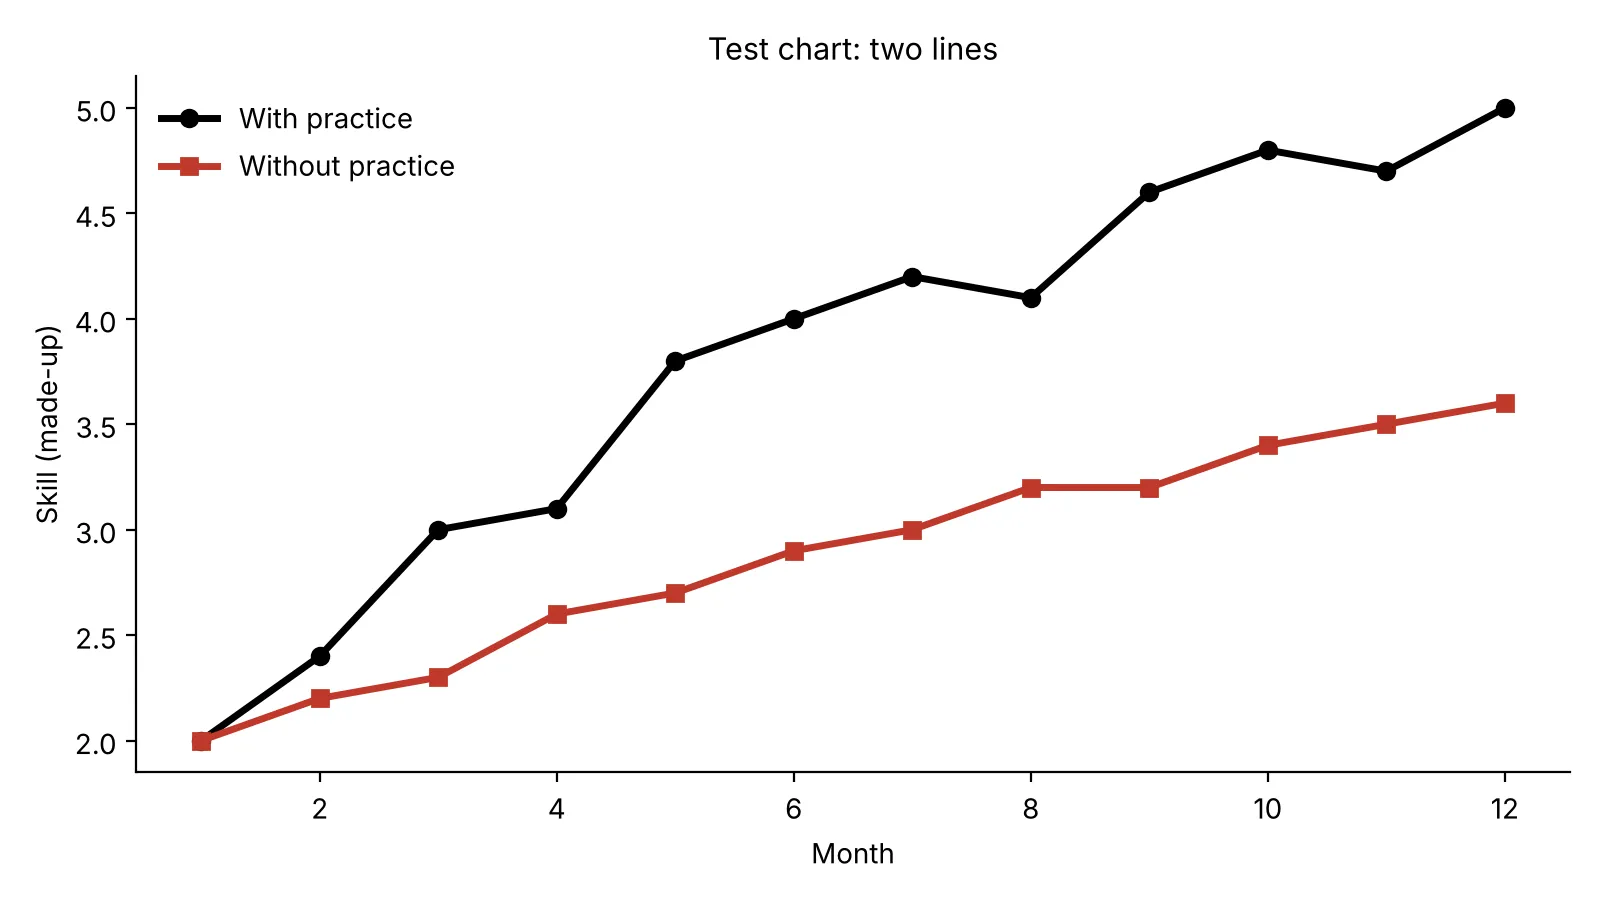
Figure 2. A line chart with two series.
After the data
A short closing paragraph sits after the last chart, to check the space between an image caption and the paragraph that follows it.